səlilwət / Burrard Inlet water quality
Contaminants tracker
Contamination has left səlilwət / Burrard Inlet largely unable to support Tsleil-Waututh’s needs and ways of life. Around 700 contaminants have been detected in the Inlet, posing risks to water values, including human consumption of seafood, cultural practices, recreation, aquatic life and wildlife. Explore the data below to see how a few example parameters compare with Water Quality Objectives across the Inlet.
Tsleil-Waututh Nation, in collaboration with the Province of BC, has updated səlilwət / Burrard Inlet Water Quality Objectives, which define how clean water, sediment, and animal tissue must be to protect these shared water values. Individual Water Quality Objectives have been set for many water quality parametersWater quality parameters are physical, chemical, and biological characteristics of a body of water. Parameters include measurable characteristics like chemical contaminant levels, germ levels, water temperature, turbidity, and others., including metals, bacteria, hydrocarbons, persistent organic pollutants, contaminants of emerging concern, and others. Each objective was set to protect the water value most sensitive to that parameter.
Governments, industries, organizations, and communities share the responsibility for reducing and maintaining contamination levels below these objectives. Attaining Water Quality Objectives will take time and require targeted, strategic action.
About səlilwət / Burrard Inlet
səlilwət, also known as Burrard Inlet, is located in southwestern mainland British Columbia by Vancouver, BC, within the traditional and unceded territories of the səlilwətaɬ (Tsleil-Waututh), xʷməθkʷəy̓əm (Musqueam) and Sḵwx̱wú7mesh (Squamish) Nations. Tsleil-Waututh means “People of the Inlet”, referring specifically to səlilwət. Since time out of mind, Tsleil-Waututh people have used, occupied, governed, and stewarded their territory. The cumulative impacts of contamination from urban and industrial development on water quality in and around səlilwət have impacted Tsleil-Waututh Nation’s Aboriginal rights and interests by reducing or eliminating opportunities to fish, harvest shellfish and practice culture.
In 2021, approximately 1.2 million people lived in the eight municipalities bordering səlilwət, using it for food, culture, transport, recreation, spiritual, aesthetic, work, industry, and other values (2021 Statistics Canada censusStatistics Canada. 2023. Census Profile. 2021 Census of Population. Statistics Canada Catalogue number 98-316-X2021001. Ottawa. Released November 15, 2023. https://www12.statcan.gc.ca/census-recensement/2021/dp-pd/prof/index.cfm?Lang=E.).
About water quality monitoring
Contaminant concentrations are measured at sites throughout the Inlet. By comparing these data with Water Quality Objectives, we can identify how and where contaminant levels are not protective of water values. Understanding contamination locations can support targeted action to identify and control pollution sources and restore water values.
For decades, multiple agencies have monitored water quality in səlilwət; however, this monitoring has been largely uncoordinated and inconsistent, which can obscure water quality trends. A coordinated monitoring approach is essential to understanding and improving water quality.
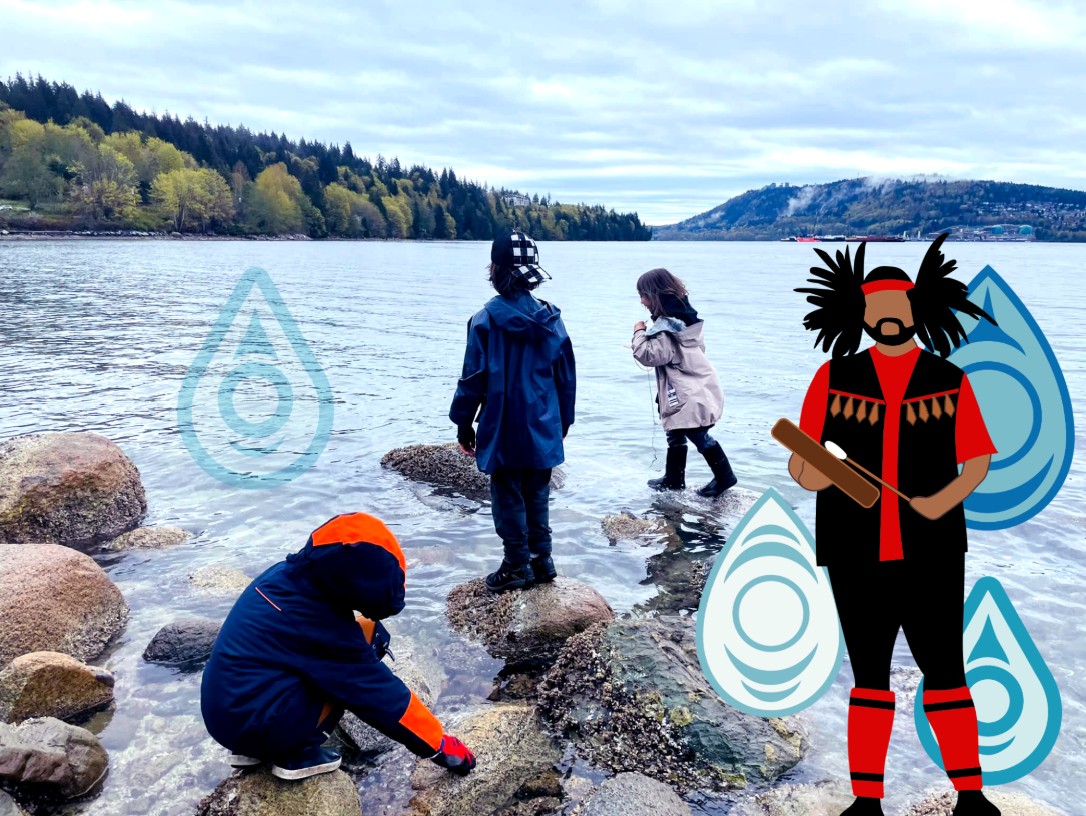
Tsleil-Waututh are the "People of the Inlet."
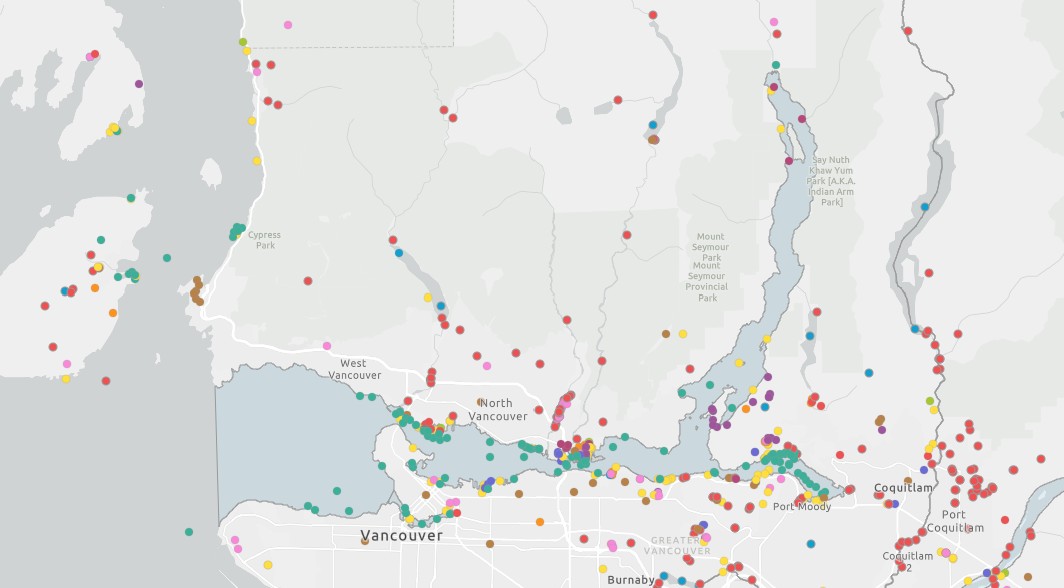
Map of surface water quality monitoring data submitted to BC's Environmental Monitoring System as of February 2026. This data repository will be replaced by BC's Environmental Monitoring Data System (EnMoDS) in March 2026.
How to read the graphs
The sections below explore two important classes of contaminants found in səlilwət: metals and fecal (poop) bacteria. These data were collected by Metro Vancouver’s ongoing Burrard Inlet Ambient Monitoring Program, which consistently collects marine water, sediment, and animal tissue samples at the same sites. This consistency allows data comparison and analysis of trends over space and time.
Monitoring sample graph
The first and most basic visualization in this contaminant tracker compares contaminant levels from individual samples with the related Water Quality Objective. These graphs include up to three elements:
- black circles showing individual sample measurements;
- a dark grey line (used when appropriate) showing summary statistics for direct comparison with Water Quality Objectives (Example: average sample value collected over 30 days);
- a dashed red line showing the Water Quality Objective.
For some parameters, like cadmium in sediment, a single sample above the Water Quality Objective line means that the water is dirtier than the objective. No dark grey line will occur on these graphs. For other parameters, like fecal coliforms and other germs from poop, an individual sample does not provide enough information to determine if water is dirtier than the Water Quality Objective. In these cases, a summary statistic—e.g., the median (middle) or average sample value—is calculated from the sample data and shown as a dark grey line. When this line is above the Water Quality Objective line, the water is dirtier than the objective. The text just below each graph explains whether to compare individual points or a line with the Water Quality Objective line.
Exceedance graph
Zooming out from individual samples, exceedance graphs provide a snapshot of the percent samples that are dirtier than, or "exceed" a Water Quality Objective. The graph should be interpreted at three scales:
- bars: Each bar summarizes all samples of a single contaminant collected at one monitoring site over a 5-year period, showing the percent of samples that exceed the objective, called "exceedances," in red. When more of the bar is red, a greater percent of samples collected during that time period were dirtier than the Water Quality Objective.
- clusters: Each cluster of bars represents a single contaminant at one monitoring site, depicting change in exceedances over time. When the amount of orange increases across bars from left to right in a cluster, there has been an increase in the percent of samples that are dirtier than the Water Quality Objective.
- entire graph: Below, there are two types of exceedance graphs. Multi-site graphs (each cluster represents a different location) visualize how changes in exceedance rates differ across sample locations. Multi-contaminant graphs (each cluster represents a different contaminant) provide a snapshot of how different contaminants are affecting water quality at a single site.
Metals
How well are we doing at keeping levels of metals in səlilwət low enough to protect water values? Explore the data below to compare concentrations of a few metals with their Water Quality Objectives.
Cadmium in sediment
Most sensitive water value: aquatic life (living beings in the water)Water quality objective: 0.7 µg/g dry weight maximum
Sample form: total cadmium
Cadmium is a trace metal that can be toxic to humans and aquatic species. Human consumption of fish containing excessive amounts of cadmium is a concern due to cadmium’s potential to accumulate in the liver and kidneys, its classification as a genotoxin, and its adverse effects on renal, endocrine, and reproductive systems (Rani et al. 2014Rani, A., Kumar, A., Lal, A. and M. Pant. 2014. Cellular mechanisms of cadmium-induced toxicity: a review. International Journal of Environmental Health Research 24: 378-399.). Excessive cadmium’s effects on fish include mortality (death) or reduced growth (AMAP 1998AMAP. 1998. Assessment report: Arctic pollution issues. Arctic Monitoring and Assessment Programme, Oslo.), deformations, behavioural changes, and decreased thyroid function (AMAP 2002AMAP. 2002. Arctic Pollution 2002. Arctic Monitoring and Assessment Programme, Oslo.). Some aquatic species, such as oysters, can rapidly accumulate cadmium within their tissues (Bendel 2009Bendell, L.I. (2009) Survey of levels of cadmium in oysters, mussels, clams and scallops from the Pacific Northwest coast of Canada, Food Additives & Contaminants: Part B, 2:2, 131-139., Zaroogian and Cheer 1976Zaroogian, G and Cheer, S. 1976. Accumulation of cadmium by the American oysters, Crassostrea virginica. Nature, 261: 408–410.).
Cadmium enters səlilwət through stormwater runoff or combined sewer overflows. Environmental processes like fires, weathering, and atmospheric deposition naturally contribute to cadmium levels. Additionally, cadmium is used in some industrial production and is present in some common items like telephone wires, vehicle radiators, motor oils, fertilizers, and cigarettes. During rainfall events, stormwater can mobilize cadmium from weathered soil and rock, contaminated surfaces, improperly disposed wastes, or sediments (Nijman and Swain 1990Nijman, R. and Swain, L. G. (1990). Coquitlam Pitt-River Area Burrard Inlet Water Quality Assessment and Objectives. Technical appendix prepared for the BC Ministry of Environment.), transporting them toward the Inlet.
How to read the monitoring sample graph (below):
Select a monitoring location from points on the map, then observe how total cadmium levels in sediment have changed since 2008. Each circle on the graph shows the amount of cadmium measured in a single sediment sample. If a circle is located above the Water Quality Objective, (shown as red dashed line ----), it indicates that the cadmium level is too high to protect aquatic life. If the circles move higher, more cadmium was measured over time. If circles move lower, less cadmium was measured over time.
or click here for all sites.
How well is this Water Quality Objective being achieved?
When contaminant levels measured in a sample are greater than or exceed the objective, they are called "exceedances." The percent of samples that are exceedances can be tracked over time to show how well an objective is achieved at a monitoring site.
How to read the exceedance graph (below):
Each cluster of bars depicts changes in the percent of exceedances recorded. Each bar represents all of the samples collected within a five-year increment at that site. In each bar, green represents the percent of sediment samples collected during that time period that contained cadmium levels less than the Water Quality Objective. When orange appears in a bar, it indicates that some samples were dirtier than, or exceeded, the objective. More orange in a bar indicates that a higher percent of samples were exceedances.
Arsenic in animal tissue
Most sensitive water value: human consumption of fish and shellfishWater quality objective: 0.0258 µg/g wet weight single-sample maximum* for all tissue types (i.e., fish or shellfish)
Sample form: total arsenic
In high concentrations, arsenic can be toxic to humans and aquatic life. Exposure, primarily through consumption of contaminated water or food, can increase risk of cancer and other adverse health effects. səlilwət / Burrard Inlet Water Quality Objectives for arsenic have been set to maintain levels below values toxic to aquatic life and to humans who consume seafood at rates relevant to coastal Indigenous peoples.
In Canada, the main natural sources of arsenic include weathering of rocks and soils. Human-made sources include smelting and refining industries, wood preservation facilities, pesticides, fossil fuel combustion, waste incineration, and manufacturing of pharmaceuticals and glass (CCME 2001CCME (Canadian Council of Ministers of the Environment). 2001. Canadian Water Quality Guidelines for the Protection of Aquatic Life: Arsenic. In Canadian environmental quality guidelines, 1999, Canadian Council of Ministers of the Environment, Winnipeg, updated 2001., Wang and Mulligan 2006Wang, S., and Mulligan, C.N. 2006. Occurrence of arsenic contamination in Canada: Sources, behavior and distribution. Science of the Total Environment, 366: 701–721.). Arsenic made available during these processes may have entered səlilwət through historical discharges, combined sewer overflows, and stormwater discharges.
The Water Quality Objective for arsenic in animal tissue is 0.0258 µg/g. Levels below the objective would protect adult subsistence fishers, meaning that the arsenic levels in səlilwət fish and shellfish would not significantly increase these fishers' risk of developing cancer if they ate these fish and shellfish over their lifetime. Samples higher than this objective do not mean there is an immediate risk to human health (ENV and HLTH, 2021ENV and HLTH (B.C. Ministry of Environment and B.C. Ministry of Health). 2021. Tissue Quality Objectives Recommendations for Burrard Inlet. Prepared for Tsleil-Waututh Nation and the Province of B.C.) but indicate that further investigation is needed to assess human health risk.
*For comparison with the Water Quality Objective, each sample is a compound sample consisting of at least 5 fish or 25 shellfish. The “single-sample maximum” is the greatest concentration of arsenic in any one of the fish or shellfish collected during the sampling event.
or click here for all sites.
Other metals
Water Quality Objectives have been set or updated for seven different metals in water, sediment, and/or tissue. As of 2020, multiple metal parameters exceeded Water Quality Objectives at each site monitored through Metro Vancouver's Burrard Inlet Ambient Monitoring Program. Action must be taken throughout the Inlet to reduce metal concentrations to levels that protect water values.
The figure below only visualizes one sample type—tissue or sediment—per metal. The plots represent a small subset of Water Quality Objectives and do not provide a full picture of the status of metals in the Inlet, safety of consuming shellfish or practicing other water values, or broader attainment of Water Quality Objectives.
or click here for all sites.
Poop bacteria
Germs from human and animal waste can cause a wide variety of diseases and restrict how people can safely interact with səlilwət. Humans can become infected through skin contact or ingestion of these germs, rendering several water values—shellfish harvest and consumption, recreation (e.g., swimming, wading, and bathing), and First Nation cultural practices—particularly sensitive to poop bacteria. Many waterborne germs originate from poor management of human waste, including sewer overflows, provincially-authorized discharges, on-site sewage disposal systems, and waste dumping from boats, with additional germs entering the Inlet from pet and wildlife waste via stormwater runoff.
The presence of poop germs in the Inlet is specified as a high priority for management in Tsleil-Waututh Nation’s (TWN’s) Burrard Inlet Action Plan (KWL 2017(KWL) Kerr Wood Leidal Associates Ltd. 2017. Burrard Inlet Action Plan. Tsleil-Waututh Nation. 106pp. https://twnsacredtrust.ca/burrard-inlet-action-plan/ (Accessed February 2020).). Since 1972, səlilwət has been closed to bivalve shellfish harvesting due to contamination from poop bacteria. Shellfish like clams, mussels, and oysters present two dangers: people can contract diseases by touching contaminated water during harvest, and the concentrated levels of germs in shellfish can cause disease outbreaks after consumption (ENV 2001British Columbia Ministry of Environment (ENV). 2001. Water Quality Criteria for Microbiological Indicators – Overview Report. https://www2.gov.bc.ca/assets/gov/environment/air-land-water/water/waterquality/waterquality-guidelines/approved-wqgs/microindicators-or.pdf (Accessed February 2020).). Although shellfish harvesting is not currently possible within most of the Inlet due to the current water quality and existing sources of pollution, Tsleil-Waututh Nation has a goal to expand harvesting opportunities within səlilwət over time.
Monitoring poop bacteria in səlilwət is essential for understanding and reducing germ levels in the Inlet, restoring safe shellfish harvest, and protecting broader water values. There is currently no efficient way to monitor all bacteria that can pose health threats. Instead, programs target a few types of germs, or “microbiological indicators,” that reflect levels of broader poop contamination. The indicators of microbiological water quality preferred by relevant health authorities are fecal coliforms, E. coli, and enterococci.
Fecal coliforms
Most sensitive water value: shellfish consumptionWater quality objective: ≤ 14 (median) MPN/100mL
Fecal coliforms are a broad group of bacteria, including E. coli, found in the intestines of warm-blooded animals. Long-term monitoring programs have collected data on fecal coliforms.
The Water Quality Objective for fecal coliforms is to be compared with the median (middle) value from at least five water quality samples collected within a 30-day period. Due to less frequent monitoring by the long-term Burrard Inlet Ambient Monitoring Program, the figure below shows the annual median. These data, collected in November of each year from the bottom of the water column, may not reflect levels at other times of the year.
This indicator and water quality objective should be considered alongside other indicators of poop bacteria for a fuller understanding of how germs are affecting water quality and water values.
or click here for all sites.
Enterococci
Most sensitive water value: shellfish consumptionWater quality objective: ≤ 4 (median) MPN/100mL
Among the indicators of poop germs, enterococci is currently the preferred indicator for poop germs in marine waters, like səlilwət, because it survives longer in salty, sunlit environments (Health Canada, 2012Health Canada. 2012. Guidelines for Canadian Recreational Water Quality – Third Edition. https://www.canada.ca/en/health-canada/services/publications/healthy-living/guidelines-canadianrecreational-water-quality-third-edition.html. (Accessed February 2020).).
As with fecal coliform, the Water Quality Objective for enterococci is to be compared with the median (middle) value from at least five water quality samples collected within a 30-day period. Due to less frequent monitoring by the long-term Burrard Inlet Ambient Monitoring Program, the figure below shows the annual median. These data, collected in November of each year from the bottom of the water column, may not reflect levels at other times of the year.
or click here for all sites.